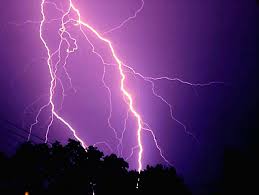
 As of mid-June, 2016 there were six lightning deaths, three in Florida, two in Louisiana and one in Mississippi, according to statistics from the National Oceanic and Atmospheric Administration (NOAA).
In 2015 the number of direct lightning fatalities was unchanged from 2014 at 26, up from a record low of 23 in 2013. From 2006 to 2015 on average about 31 people died each year from lightning strikes in the United States, according to the National Weather Service. Going back over the last 30 years, 48 people died each year on average from lightning strikes. The significant decline in lightning deaths is due to fewer farmers working in fields, along with technological advances, better lightning protection and awareness of lightning safety.
The top states for lightning deaths in 2015 were Florida, with five deaths, Alabama with four deaths and Arizona with three deaths. Iowa, North Carolina and New Mexico each had two deaths. Eight additional states reported one lightning death in 2015: Arkansas, California, Colorado, Missouri, South Dakota, Texas, Utah and West Virginia.
LIGHTNING FATALITIES BY STATE, 2015

Source: U.S. Department of Commerce, National Oceanic and Atmospheric Administration, National Weather Service.
View Archived Graphs
Homeowners Insurance Losses
The number of claims from lightning strikes in the United States fell in 2015; however, the total insurers paid on those claims rose by nearly 7 percent, according to an analysis by the Insurance Information Institute (I.I.I.) and State Farm®. Lightning strikes cost $790 million in homeowners insurance losses in 2015 with the average claim costing $7,947 vs. $7,400 in 2014. “The average cost per claim is volatile from year to year,” said James Lynch, FCAS MAAA, vice president of Information Services and chief actuary, “but it has generally continued to rise, in part because of the enormous increase in the number and value of consumer electronics including increasingly popular home automation systems.” Florida had the largest number of homeowner insurance claims for lightning losses in 2015, followed by Georgia and Texas.
Homeowners Insurance Claims And Payout For Lightning Losses, 2011-2015
Source: Insurance Information Institute, State Farm®.View Archived Tables |
||||||||||||||||||||||||||||||||||||||||||
2015 WEATHER EVENTS, FATALITIES, INJURIES AND DAMAGE (1)
|
(1) Includes the 50 states, Puerto Rico, Guam and the Virgin Islands.
Source: U.S. Department of Commerce, National Oceanic and Atmospheric Administration, National Weather Service.
View Archived Tables
Top 10 States For Homeowners Insurance Lightning Losses By Number Of Claims, 2015
Source: Insurance Information Institute, State Farm®.View Archived Tables |
|
Lightning Fires in Residential Vs. Non-Residential Properties
From 2007 to 2011 local U.S. fire departments responded to an average of 22,600 fires per year that were started by lighting, according to an analysis by the National Fire Protection Association (NFPA). These fires caused an average of nine civilian deaths and $451 million in direct property damage per year, according to the NFPA. Home fires accounted for 19 percent of the lightning fires, fires in non-residential structures, including businesses and other non-residential properties, accounted for 7 percent; vehicle fires accounted for 1 percent. The remaining 73 percent were in outdoor and unclassified properties.
Lightning fires in non-residential properties caused an average of $108 million in direct property damage each year from 2007 to 2011, according to the survey. The average annual damage in non-residential properties includes:
- $28 million in storage facilities
- $22 million in places of assembly, such as houses of worship and restaurants
- $19 million in nonhome residential properties such as hotels and motels
- $15 million in mercantile and business properties such as offices, specialty shops and department stores
- $15 million in industrial and manufacturing facilities
- $3 million in outside properties
- $3 million in educational and healthcare facilities
- $3 million in miscellaneous properties
FIRES STARTED BY LIGHTNING BY TYPE OF STRUCTURE, 2007-2011 (1)

(1) Reported to local fire departments.
Source: National Fire Protection Association.
View Archived Graphs
LIGHTNING INCIDENTS BY MONTH, 2007-2011

Source: National Fire Protection Association.
View Archived Graphs
Source: Insurance Information Institute http://www.iii.org/
