Winter Driving Safety Tips

Winter Driving Safety Tips | Travelers Insurance

Care driving behind other cars in the winter

Falling snow can be picturesque, but it can also wreak havoc on the roads. While no one enjoys driving in snowy or slippery conditions, there are steps you can take to help improve your safety with these winter driving tips.

Here are some guidelines that can help you stay safe when driving in adverse winter conditions:

  • Make sure your car is prepared for cold temperatures and wintery conditions like snow and ice. Keep your equipment properly maintained and include a winter survival kit in your vehicle: an ice scraper, snow shovel and sand/salt.
  • Clear snow and ice off your car – including windows, mirrors, lights, reflectors, hood, roof and trunk.
  • Drive with your headlights on, and be sure to keep them clean to improve visibility.
  • Use caution when snow banks limit your view of oncoming traffic.
  • Avoid using cruise control in snowy or icy conditions. In adverse conditions, you want as much control of your car as possible.
  • Know how to brake on slippery surfaces. Vehicles with anti-lock brakes operate much differently from those that do not have anti-lock brakes. You should consult your vehicle’s owner’s manual for instructions on how to brake properly if your vehicle should start to skid.
  • Maintain at least a half tank of gas during the winter season. This helps ensure you have a source of heat if you are stuck or stranded.
  • If you do venture out or are unexpectedly caught in a snowstorm and encounter problems, stay in your car and wait for help. You can run the car heater to stay warm for 10 minutes every hour, but make sure your exhaust pipe is clear of snow. There is a danger of carbon monoxide poisoning if snow blocks the pipe and enables the deadly gas to build up in your car. Open your window slightly to help prevent the buildup.
  • Keep your windshield washer reservoir full, and make sure your car has wiper blades that are in good condition.
  • Remember that speed limits are meant for dry roads, not roads covered in snow and ice. You should reduce your speed and increase your following distance as road conditions and visibility worsen.
  • Be cautious on bridges and overpasses as they are commonly the first areas to become icy.
  • Avoid passing snow plows and sand trucks. The drivers can have limited visibility, and the road in front of them could be worse than the road behind.
  • Monitor road and weather conditions by checking local news stations or Internet traffic and weather sites.
  • If you must travel during a snowstorm or in blizzard conditions, be sure to let a relative, friend or coworker know where you are headed and your expected arrival time. Avoid the temptation to check or be on your phone while driving as all of your attention should be on arriving safely

Snow Shoveling Safety Tips

Snow Shoveling Safety Tips | Travelers Insurance

Person shoveling snow outside house

When the driveway and walkways are coated in a thick blanket of snow, it is time to get a shovel out for what some consider to be a dreaded chore. But before you tackle the first snowfall of the season, take some time to read these safety snow shoveling tips to help avoid any potential injuries.

Snow shoveling can lead to a number of health risks for many people, from back injuries to heart attacks. The mix of cold temperatures and physical exertion increases the workload on the heart,¹ which may increase the risk of a heart attack for some. According to the American Heart Association, even walking through heavy, wet snow can place strain on your heart.

The following tips can help keep you safer when you set out to shovel:

  • Warm up. Warm your muscles before heading out to shovel by doing some light movements, such as bending side to side or walking in place.
  • Push rather than lift. Pushing the snow with the shovel instead of lifting can help reduce the strain on your body. When lifting snow, bend your knees and use your legs when possible.
  • Choose your shovel wisely. Ergonomically-designed shovels can help reduce the amount of bending you have to do.
  • Lighten your load. Consider using a lighter-weight plastic shovel instead of a metal one to help decrease the weight being lifted.
  • Hit the pause button. Pace yourself and be sure to take frequent breaks. Consider taking a break after 20 to 30 minutes of shoveling, especially when the snow is wet.
  • Consider multiple trips. Consider shoveling periodically throughout the storm to avoid having to move large amounts of snow at once.
  • Keep up with snowfall. Try to shovel snow shortly after it falls, when it is lighter and fluffier. The longer snow stays on the ground, the wetter it can become. Wet snow is heavier and harder to move.
  • Wear layers. Dress in layers and remove them as you get warm to help maintain a comfortable body temperature.
  • Stay hydrated. Drink plenty of water to stay hydrated while shoveling.

A national study² found that the most common shoveling-related injuries were to the lower back. Cardiac-related injuries account for only 7% of all injuries, but they were the most serious in nature. If you do not exercise on a regular basis, are middle-aged or older, or have any health conditions, such as heart disease or high blood pressure, you should check with your doctor before doing any strenuous shoveling. Consider using a snow blower or snow removal service as an alternative means of snow removal.

Snow and Ice Removal Requirements

Snow and ice not only pose a potential risk to you but also to others. As a property owner, you are responsible for making a reasonable effort to keep public walking areas around your property clear of snow and ice. Pre-treating your walkways and other paved surfaces with an anti-icing product can help make snow and ice removal easier.

Consider stocking up on ice melt in advance, as it sometimes sells out during long winters. You can store unused ice melt in an airtight container, out of reach from children and pets. Be aware that rock salt can damage brick, stone, asphalt and concrete walkways.

Be sure to check your local codes and ordinances regarding snow and ice removal requirements

How to Identify and Help Remove an Ice Dam

How to Identify and Help Remove an Ice Dam | Travelers Insurance

Sometimes, even your best efforts to prevent an ice dam may not be enough. Knowing what an ice dam is, how to identify one and how to help remove it is important to protecting your roof and home from potential damage during the snowy, winter months.

What Is an Ice Dam?

Ice dams may form when water from melting snow freezes into ice at the edge of your roofline. Without proper roof snow removal, the ice that develops may grow large enough to prevent water from melting snow from properly draining off the roof. When the water is unable to drain from the roof, it may then back up underneath roof shingles and make its way into your home.

How does an ice dam form?How does an ice dam form?

Do You Have an Ice Dam?

Most ice dams develop on the edge of your roof, but they may also form in other locations, depending on the slope, orientation and style of your roof. Be sure to monitor the weather and your roof for signs of ice dam formations.

  • Look closely at the icicles around the exterior of your house. If the icicles are confined to the gutters and there is no water trapped behind them, then an ice dam has likely not formed. Nonetheless, icicles can be a precursor to ice dams. Depending on their location and size, icicles may also pose a danger if they fall off. Whenever possible, and if safe to do so, remove icicles from the exterior of your home, making sure not to stand directly beneath them. If you cannot safely reach the icicles from the ground, consider hiring a contractor to assist in their removal.
  • Check for water stains or moisture in your attic or along the ceiling of exterior walls of your house. Water stains or moisture may be an indication that an ice dam has formed and water has penetrated the roof membrane.

How to Remove an Ice Dam

Removing an ice dam from your roof immediately after spotting the signs can be critical to helping prevent damage to your home. One way to remove an ice dam is to melt it using calcium chloride ice melt.

Step 1. Using a roof rake, remove snow 3-4 feet from the edge of your roof, being careful not to damage the roof covering or to allow snow to build up around walking paths or to block emergency exits.

Step 2. Use a calcium chloride ice melt product, which you can generally purchase from your local hardware store. Be sure not to use rock salt or sodium chloride, which can damage your roof.

Step 3. Fill a nylon stocking with the calcium chloride ice melt.

Step 4. Safely place and position the calcium chloride-filled nylon stocking vertically across the ice dam so that it can melt a channel through the ice.

Step 5. Cover and protect any shrubbery and plants with lightweight tarps near the gutters or downspouts for the duration that the calcium chloride stockings remain in place. This is important because the calcium chloride-saturated water dripping from the roof may damage the shrubbery and plants.

REMEMBER: Using a ladder in snowy and icy conditions may be dangerous. If you cannot safely reach the roof, consider hiring a contractor.

What ARE your chances of being hit by lighting?

lightning
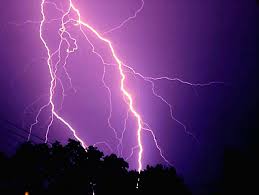
As of mid-June, 2016 there were six lightning deaths, three in Florida, two in Louisiana and one in Mississippi, according to statistics from the National Oceanic and Atmospheric Administration (NOAA).

In 2015 the number of direct lightning fatalities was unchanged from 2014 at 26, up from a record low of 23 in 2013. From 2006 to 2015 on average about 31 people died each year from lightning strikes in the United States, according to the National Weather Service. Going back over the last 30 years, 48 people died each year on average from lightning strikes. The significant decline in lightning deaths is due to fewer farmers working in fields, along with technological advances, better lightning protection and awareness of lightning safety.

The top states for lightning deaths in 2015 were Florida, with five deaths, Alabama with four deaths and Arizona with three deaths. Iowa, North Carolina and New Mexico each had two deaths. Eight additional states reported one lightning death in 2015: Arkansas, California, Colorado, Missouri, South Dakota, Texas, Utah and West Virginia.

LIGHTNING FATALITIES BY STATE, 2015

Source: U.S. Department of Commerce, National Oceanic and Atmospheric Administration, National Weather Service.
View Archived Graphs

Homeowners Insurance Losses

The number of claims from lightning strikes in the United States fell in 2015; however, the total insurers paid on those claims rose by nearly 7 percent, according to an analysis by the Insurance Information Institute (I.I.I.) and State Farm®. Lightning strikes cost $790 million in homeowners insurance losses in 2015 with the average claim costing $7,947  vs. $7,400 in 2014. “The average cost per claim is volatile from year to year,” said James Lynch, FCAS MAAA, vice president of Information Services and chief actuary, “but it has generally continued to rise, in part because of the enormous increase in the number and value of consumer electronics including increasingly popular home automation systems.” Florida had the largest number of homeowner insurance claims for lightning losses in 2015, followed by Georgia and Texas.


Homeowners Insurance Claims And Payout For Lightning Losses, 2011-2015

Percent change
2011 2012 2013 2014 2015 2014-2015 2011-2015
Number of paid claims 186,307 151,000 114,740 99,871 99,423 -0.4% -46.6%
Insured losses ($ millions) $952.5 $969.0 $673.5 $739.0 $790.1 6.9% -17.0%
Average cost per claim $5,112 $6,400 $5,869 $7,400 $7,947 7.4% 55.5%
Source: Insurance Information Institute, State Farm®.
View Archived Tables

2015 WEATHER EVENTS, FATALITIES, INJURIES AND DAMAGE (1)

Weather events Fatalities Injuries Property damage
($ millions)
Crop damage
($ millions)
Total damage
($ millions)
Lightning 27 130 $16.31 $0.00 $16.31
Tornado 36 924 316.78 3.64 320.42
Thunderstorm wind 41 159 252.00 15.79 267.79
Hail 0 0 586.02 132.97 718.99
Total 104 1,213 $1,171.11 $152.40 $1,323.51
(1) Includes the 50 states, Puerto Rico, Guam and the Virgin Islands.
Source: U.S. Department of Commerce, National Oceanic and Atmospheric Administration, National Weather Service.
View Archived Tables

Top 10 States For Homeowners Insurance Lightning Losses By Number Of Claims, 2015

Rank State Number of paid claims Insured losses ($ millions) Average cost per claim
1 Florida 11,898 $156.2 $13,131
2 Georgia 10,442 61.0 5,844
3 Texas 8,844 84.9 9,595
4 Louisiana 5,333 24.4 4,578
5 Alabama 4,508 28.3 6,280
6 North Carolina 4,226 28.8 6,810
7 Pennsylvania 3,686 13.2 3,579
8 Tennessee 3,397 24.5 7,212
9 Virginia 3,174 21.0 6,607
10 South Carolina 3,163 13.7 4,318
Total, top 10 58,671 $455.9 $7,771
Source: Insurance Information Institute, State Farm®.
View Archived Tables
  • There were 11,898 lightning-related homeowners insurance claims in Florida in 2015, the highest among the states.

Lightning Fires in Residential Vs. Non-Residential Properties

From 2007 to 2011 local U.S. fire departments responded to an average of 22,600 fires per year that were started by lighting, according to an analysis by the National Fire Protection Association (NFPA). These fires caused an average of nine civilian deaths and $451 million in direct property damage per year, according to the NFPA. Home fires accounted for 19 percent of the lightning fires, fires in non-residential structures, including businesses and other non-residential properties, accounted for 7 percent; vehicle fires accounted for 1 percent. The remaining 73 percent were in outdoor and unclassified properties.

Lightning fires in non-residential properties caused an average of $108 million in direct property damage each year from 2007 to 2011, according to the survey. The average annual damage in non-residential properties includes:

  • $28 million in storage facilities
  • $22 million in places of assembly, such as houses of worship and restaurants
  • $19 million in nonhome residential properties such as hotels and motels
  • $15 million in mercantile and business properties such as offices, specialty shops and department stores
  • $15 million in industrial and manufacturing facilities
  • $3 million in outside properties
  • $3 million in educational and healthcare facilities
  • $3 million in miscellaneous properties

FIRES STARTED BY LIGHTNING BY TYPE OF STRUCTURE, 2007-2011 (1)

(1) Reported to local fire departments.
Source: National Fire Protection Association.
View Archived Graphs

LIGHTNING INCIDENTS BY MONTH, 2007-2011

Source: National Fire Protection Association.
View Archived Graphs

Source: Insurance Information Institute http://www.iii.org/

Accidents and Drivers with No Insurance: Now What?!

accidentUninsured Motorists

Uninsured and underinsured motorist coverage reimburses policyholders in an accident involving an uninsured, underinsured or hit-and-run driver. Twenty states and the District of Columbia have mandatory requirements for uninsured or underinsured motorist coverage. A handful of states, including Nevada and Texas, have passed laws and begun to develop and implement online auto insurance verification systems to identify uninsured motorists.

In 2012, 12.6 percent of motorists, or about one in eight drivers, was uninsured, according to a 2014 study by the Insurance Research Council (IRC). The percentage has been declining in recent years. Oklahoma had the highest percentage of uninsured motorists, 26 percent, and Massachusetts had the lowest, 4 percent. IRC measures the number of uninsured motorists based on insurance claims, using a ratio of insurance claims made by people who were injured by uninsured drivers relative to the claims made by people who were injured by insured drivers.

ESTIMATED PERCENTAGE OF UNINSURED MOTORISTS, 1992-2012 (1)

Year Percent
1992 15.6%
1993 16.0
1994 15.1
1995 14.2
1996 13.8
1997 13.2
1998 13.0
1999 12.8
2000 13.4
2001 14.2
2002 14.5
2003 14.9
2004 14.6
2005 14.6
2006 14.3
2007 13.8
2008 14.3
2009 13.8
2010 12.3
2011 12.2
2012 12.6
(1) Percentage of uninsured drivers, as measured by the ratio of uninsured motorists (UM) claims to bodily injury (BI) claim frequencies.
Source: Insurance Research Council.
View Archived Tables

TOP 10 HIGHEST AND LOWEST STATES BASED ON ESTIMATED PERCENTAGE OF UNINSURED MOTORISTS, 2012 (1)

Rank Highest Percent uninsured Rank Lowest Percent uninsured
1 Oklahoma 25.9% 1 Massachusetts 3.9%
2 Florida 23.8 2 Maine 4.7
3 Mississippi 22.9 3 New York 5.3
4 New Mexico 21.6 4 Utah 5.8
5 Michigan 21.0 5 North Dakota 5.9
6 Tennessee 20.1 6 Pennsylvania 6.5
7 Alabama 19.6 7 Nebraska 6.7
8 Rhode Island 17.0 8 Idaho 6.7
9 Colorado 16.2 9 South Carolina 7.7
10 Washington 16.1 10 South Dakota 7.8
(1) Percentage of uninsured drivers, as measured by the ratio of uninsured motorists (UM) claims to bodily injury (BI) claim frequencies.
Source: Insurance Research Council.
View Archived Tables

ESTIMATED PERCENTAGE OF UNINSURED MOTORISTS BY STATE, 2012 (1)

State Uninsured Rank (2) State Uninsured Rank (2)
Alabama 19.6% 7 Montana 14.1% 15
Alaska 13.2 21 Nebraska 6.7 44
Arizona 10.6 29 Nevada 12.2 23
Arkansas 15.9 11 New Hampshire 9.3 34
California 14.7 13 New Jersey 10.3 30
Colorado 16.2 9 New Mexico 21.6 4
Connecticut 8.0 41 New York 5.3 49
Delaware 11.5 27 North Carolina 9.1 35
D.C. 11.9 24 North Dakota 5.9 47
Florida (3) 23.8 2 Ohio 13.5 17
Georgia 11.7 26 Oklahoma 25.9 1
Hawaii 8.9 37 Oregon 9.0 36
Idaho 6.7 45 Pennsylvania 6.5 46
Illinois 13.3 20 Rhode Island 17.0 8
Indiana 14.2 14 South Carolina 7.7 43
Iowa 9.7 32 South Dakota 7.8 42
Kansas 9.4 33 Tennessee 20.1 6
Kentucky 15.8 12 Texas 13.3 19
Louisiana 13.9 16 Utah 5.8 48
Maine 4.7 50 Vermont 8.5 39
Maryland 12.2 22 Virginia 10.1 31
Massachusetts 3.9 51 Washington 16.1 10
Michigan 21.0 5 West Virginia 8.4 40
Minnesota 10.8 28 Wisconsin 11.7 25
Mississippi 22.9 3 Wyoming 8.7 38
Missouri 13.5 18
(1) Percentage of uninsured drivers, as measured by the ratio of uninsured motorists (UM) claims to bodily injury (BI) claim frequencies.
(2) Rank calculated from unrounded data.
(3) In Florida, compulsory auto laws apply to personal injury protection (PIP) and physical damage, but not to third party bodily injury coverage.
Source: Insurance Research Council.
View Archived Tables

AUTOMOBILE FINANCIAL RESPONSIBILITY LIMITS AND ENFORCEMENT BY STATE

(As of May 2016)

State Insurance required (1) Minimum liability limits (2) Insurer verification of insurance (3)
AL BI & PD Liab 25/50/25 c, d
AK BI & PD Liab 50/100/25 a
AZ BI & PD Liab 15/30/10 a, b
AR BI & PD Liab, PIP 25/50/25 b, d
CA BI & PD Liab 15/30/5 (4) a, b, d
CO BI & PD Liab 25/50/15 a, d
CT BI & PD Liab, UM, UIM 20/40/10 d
DE BI & PD Liab, PIP 15/30/10 a, b, c, d
DC BI & PD Liab, PIP, UM 25/50/10 a, c, d
FL PD Liab, PIP 10/20/10 (5) a, d
GA BI & PD Liab 25/50/25 a, d
HI BI & PD Liab, PIP 20/40/10 a
ID BI & PD Liab 25/50/15 d
IL BI & PD Liab, UM, UIM 25/50/20 a, b, c
IN BI & PD Liab 25/50/25* a
IA BI & PD Liab 20/40/15 a
KS BI & PD Liab, PIP 25/50/25** a,c, d
KY BI & PD Liab, PIP 25/50/10 (5) a, d
LA BI & PD Liab 15/30/25 a, d
ME BI & PD Liab, UM 50/100/25 (6) b
MD BI & PD Liab, PIP, UM, UIM 30/60/15 a, d
MA BI & PD Liab, PIP, UM 20/40/5 a, d
MI BI & PD Liab, PIP 20/40/10 a
MN BI & PD Liab, PIP, UM, UIM 30/60/10 a, c
MS BI & PD Liab 25/50/25 a, d
MO BI & PD Liab, UM 25/50/10 a, c, d
MT BI & PD Liab 25/50/20 d
NE BI & PD Liab, UM, UIM 25/50/25 a, b, d
NV BI & PD Liab 15/30/10 a, d
NH FR only, UM 25/50/25 (6) a
NJ BI & PD Liab, PIP, UM, UIM 15/30/5 (7) a, d
NM BI & PD Liab 25/50/10 a, c
NY BI & PD Liab, PIP, UM 25/50/10 (8) a, d
NC BI & PD Liab, UM, UIM (9) 30/60/25 a, d
ND BI & PD Liab, PIP, UM, UIM 25/50/25 c
OH BI & PD Liab 25/50/25 a, c
OK BI & PD Liab 25/50/25 a, c, d
OR BI & PD Liab, PIP, UM, UIM 25/50/20 a, c, d
PA BI & PD Liab, PIP 15/30/5 a
RI BI & PD Liab 25/50/25 (5) d
SC BI & PD Liab, UM 25/50/25 a, d
SD BI & PD Liab, UM, UIM 25/50/25 a
TN BI & PD Liab 25/50/15 (5) a, d
TX BI & PD Liab 30/60/25 a, d***
UT BI & PD Liab, PIP 25/65/15 (5) d
VT BI & PD Liab 25/50/10 c
VA BI & PD Liab (10), UM, UIM 25/50/20 a, b, c, d
WA BI & PD Liab 25/50/10 a
WV BI & PD Liab, UM 25/50/25 a, d
WI BI & PD Liab, UM 25/50/10 a
WY BI & PD Liab 25/50/20 c, d
(1) Compulsory Coverages:
BI Liab=Bodily injury liability
PD Liab=Property damage liability
UM=Uninsured motorist
PD=Physical damage
Med=First party (policyholder) medical expenses
UIM=Underinsured motorist
PIP=Personal Injury Protection. Mandatory in no-fault states. Includes medical, rehabilitation, loss of earnings and funeral expenses. In some states PIP includes essential services such as child care.
FR=Financial responsibility only. Insurance not compulsory.
(2) The first two numbers refer to bodily injury liability limits and the third number to property damage liability. For example, 20/40/10 means coverage up to $40,000 for all persons injured in an accident, subject to a limit of $20,000 for one individual, and $10,000 coverage for property damage.
(3) a. Insurer must notify Department of Motor Vehicles or other state agency of cancellation or nonrenewal.
b. Insurer must verify financial responsibility or insurance after an accident or arrest.
c.Insurer must verify randomly selected insurance policies upon request.
d. Insurers must submit entire list of insurance in effect, which may be compared with registrations at a state agency. Also known as a computer data law or online verification system. Also includes cases where insurers are required to report new issues and/or renewals.
(4) Low-cost policy limits for low-income drivers in the California Automobile Assigned Risk Plan are 10/20/3.
(5) Instead of policy limits, policyholders can satisfy the requirement with a combined single limit policy. Amounts vary by state.
(6) In addition, policyholders must also have coverage for medical payments. Amounts vary by state.
(7) Basic policy (optional) limits are 10/10/5. Uninsured and underinsured motorist coverage not available under the basic policy but uninsured motorist coverage is required under the standard policy. Special Automobile Insurance Policy available for certain drivers which only covers emergency treatment and a $10,000 death benefit.
(8) In addition, policyholders must have 50/100 for wrongful death coverage.
(9) Mandatory in policies with UM limits exceeding 30/60.
(10) Compulsory to buy insurance or pay an Uninsured Motorists Vehicle (UMV) fee to the state Department of Motor Vehicles.
* Effective July 1, 2017.
**Effective January 1, 2017.
***Implementation by January 1, 2017.
Source: Property Casualty Insurers Association of America; state departments of insurance and motor vehicles.

Source: Insurance Information Institute http://www.iii.org/

Identity Theft and Cybercrime: Which State Ranks Highest?

ThiefTHE SCOPE OF IDENTITY THEFT

The 2016 Identity Fraud Study, released by Javelin Strategy & Research, found that $15 billion was stolen from 13.1 million U.S. consumers in 2015, compared with $16 billion and 12.7 million victims a year earlier. In the past six years identity thieves have stolen $112 billion.

Following the introduction of microchip equipped credit cards in 2015 in the United States, which make the cards difficult to counterfeit, criminals focused on new account fraud. This type of fraud more than doubled and now accounts for 20 percent of all fraud losses. New account fraud occurs when a thief opens a credit card or other financial account using a victim’s name and other stolen personal information.

IDENTITY THEFT AND FRAUD COMPLAINTS

The Consumer Sentinel database, maintained by the Federal Trade Commission (FTC), contains over 10 million consumer fraud and identity theft complaints that have been filed with federal, state and local law enforcement agencies and private organizations from 2010 to 2014. In 2014 over 2.5 million complaints were filed.

Of the 2.5 million complaints received in 2014, 60 percent were related to fraud, 13 percent were related to identity theft, and 27 percent were for other consumer complaints. The FTC identifies 30 types of complaints. In 2014, for the 15th year in a row, identity theft was the No. 1 type of complaint among the 30 categories, accounting for 332,646 complaints, followed by debt collection, with 280,998 complaints. Internet services, with 46,039 complaints, ranked tenth.

IDENTITY THEFT AND FRAUD COMPLAINTS, 2012-2014 (1)

(1) Percentages are based on the total number of Consumer Sentinel Network complaints by calendar year. These figures exclude “Do Not Call” registry complaints.

Source: Federal Trade Commission.

View Archived Graphs

HOW VICTIMS’ INFORMATION IS MISUSED, 2014 (1)

Type of identity theft fraud Percent
Government documents or benefits fraud 38.7%
Credit card fraud 17.4
Phone or utilities fraud 12.5
Bank fraud (2) 8.2
Attempted identity theft 4.8
Employment-related fraud 4.8
Loan fraud 4.4
Other identity theft 21.8

(1) Percentages are based on the total number of complaints in the Federal Trade Commission’s Consumer Sentinel Network (332,646 in 2014). Percentages total to more than 100 because some victims reported experiencing more than one type of identity theft.
(2) Includes fraud involving checking, savings and other deposit accounts and electronic fund transfers.

Source: Federal Trade Commission.

View Archived Tables

IDENTITY THEFT BY STATE, 2014

State Complaints per
100,000 population (1)
Number of
complaints
Rank (2) State Complaints per
100,000 population (1)
Number of
complaints
Rank (2)
Alabama 77.7 3,770 22 Montana 57.2 585 40
Alaska 73.6 542 29 Nebraska 48.6 914 46
Arizona 96.0 6,460 9 Nevada 100.2 2,846 8
Arkansas 83.6 2,481 15 New Hampshire 54.7 726 41
California 100.5 38,982 7 New Jersey 79.9 7,144 19
Colorado 85.5 4,579 13 New Mexico 77.2 1,611 23
Connecticut 85.4 3,071 14 New York 80.8 15,959 17
Delaware 78.1 731 21 North Carolina 73.8 7,334 27
Florida 186.3 37,059 1 North Dakota 43.1 319 48
Georgia 112.7 11,384 5 Ohio 79.0 9,161 20
Hawaii 40.9 580 49 Oklahoma 68.5 2,656 32
Idaho 58.9 962 39 Oregon 124.6 4,946 3
Illinois 95.6 12,317 12 Pennsylvania 81.7 10,446 16
Indiana 68.2 4,498 33 Rhode Island 66.2 699 34
Iowa 48.5 1,506 47 South Carolina 73.3 3,540 30
Kansas 65.2 1,892 35 South Dakota 36.3 310 50
Kentucky 53.4 2,358 43 Tennessee 76.2 4,993 24
Louisiana 73.8 3,430 27 Texas 95.9 25,843 10
Maine 52.1 693 44 Utah 53.9 1,586 42
Maryland 95.9 5,734 10 Vermont 64.2 402 36
Massachusetts 75.8 5,116 25 Virginia 71.1 5,921 31
Michigan 104.3 10,338 6 Washington 154.8 10,930 2
Minnesota 59.2 3,229 38 West Virginia 61.4 1,136 37
Mississippi 80.5 2,409 18 Wisconsin 74.4 4,283 26
Missouri 118.7 7,195 4 Wyoming 49.1 287 45

(1) Population figures are based on the 2014 U.S. Census population estimates.
(2) Ranked per complaints per 100,000 population. The District of Columbia had 142.8 complaints per 100,000 population and 941 victims. States with the same ratio of complaints per 100,000 population receive the same rank.

Source: Federal Trade Commission.

View Archived Tables

See also the Identity Theft section of our Web site Click Here

CYBERCRIME

As businesses increasingly depend on electronic data and computer networks to conduct their daily operations, growing pools of personal and financial information are being transferred and stored online. This can leave individuals exposed to privacy violations and financial institutions and other businesses exposed to potentially enormous liability, if and when a breach in data security occurs.

In 2000 the Federal Bureau of Investigation, the National White Collar Crime Center and the Bureau of Justice Assistance joined together to create the Internet Crime Complaint Center (IC3) to monitor Internet-related criminal complaints. In 2014 the IC3 received and processed 269,422 complaints, averaging about 22,500 complaints per month. The IC3 reports that 123,684 of these complaints involved a dollar loss and puts total dollar losses at over $800 million. The most common complaints received in 2014 involved auto and real estate fraud and government impersonation email scams.

Interest in cyber insurance and risk has grown in 2014 and 2015 as a result of high-profile data breaches, including a massive data breach at health insurer Anthem that exposed data on 78.8 million customers and employees, and another at Premera Blue Cross that compromised the records of 11 million customers. The U.S. government was targeted by hackers in two separate attacks in May 2015 that compromised the personnel records of as many as 14 million current and former civilian government employees. A state-sponsored attack against Sony Pictures Entertainment, allegedly by North Korea, made headlines in late 2014.

Cyberattacks and breaches have grown in frequency, and losses are on the rise. In 2014 the number of U.S. data breaches hit a record 783, with 85.6 million records exposed. At 781 in 2015, the number of breaches was about the same, but the number of records exposed doubled to about 169 million. The majority of the 781 data breaches in 2015 affected medical/healthcare organizations (66.7 percent of total breaches) and government/military (20.2 percent), according to the Identity Theft Resource Center. These figures do not include the many attacks that go unreported. In addition, many attacks go undetected. Despite conflicting analyses, the costs associated with these losses are increasing. McAfee and the Center for Strategic and International Studies (CSIS) estimated the likely annual cost to the global economy from cybercrime is $445 billion a year, with a range of between $375 billion and $575 billion.

NUMBER OF DATA BREACHES AND RECORDS EXPOSED, 2006-2015

Source: Identity Theft Resource Center.

View Archived Graphs

CYBERCRIME COMPLAINTS, 2010-2014 (1)

(1) Based on complaints submitted to the Internet Crime Complaint Center.

Source: Internet Crime Complaint Center.

View Archived Graphs

TOP 10 STATES FOR CYBERCRIME, 2014

Rank State Percent (1)
1 California 12.54%
2 Florida 7.56
3 Texas 6.87
4 New York 5.85
5 Pennsylvania 3.30
6 Illinois 3.14
7 Virginia 2.88
8 New Jersey 2.85
9 Washington 2.59
10 Ohio 2.48

(1) Percent of complaints submitted to the Internet Crime Complaint Center via its website.

Source: Internet Crime Complaint Center.

Source: Insurance Information Institute http://www.iii.org/

How much homeowners insurance do I need?

home

You need enough insurance to cover the following:

  1.  The structure of your home.
  2. Your personal possessions.
  3. The cost of additional living expenses if your home is damaged and you have to live elsewhere during repairs.
  4. Your liability to others.

The structure

You need enough insurance to cover the cost of rebuilding your home at current construction costs. Don’t include the cost of the land. And don’t base your rebuilding costs on the price you paid for your home. The cost of rebuilding could be more or less than the price you paid or could sell it for today.

Some banks require you to buy homeowners insurance to cover the amount of your mortgage. If the limit of your insurance policy is based on your mortgage, make sure it’s enough to cover the cost of rebuilding. (If your mortgage is paid off, don’t cancel your homeowners policy. Homeowners insurance protects your investment in your home.)

For a quick estimate of the amount of insurance you need, multiply the total square footage of your home by local building costs per square foot. To find out construction costs in your community, call your local real estate agent, builders association or insurance agent.

Factors that will determine the cost of rebuilding your home:

  • Local construction costs
  • The square footage of the structure
  • The type of exterior wall construction–frame, masonry (brick or stone) or veneer
  • The style of the house (ranch, colonial)
  • The number of bathrooms and other rooms
  • The type of roof and materials used
  • Other structures on the premises such as garages, sheds
  • Fireplaces, exterior trim and other special features like arched windows
  • Whether the house, or parts of it like the kitchen, was custom built
  • Improvement to your home–adding a second bathroom, enlarging the kitchen or other additions that have added value to your home

Standard homeowners policies provide coverage for disasters such as damage due to fire, lightning, hail, explosions and theft. They do not cover floods, earthquakes or damage caused by lack of routine maintenance.

Flood insurance is available from the National Flood Insurance Program – NFIP and from some private insurers. Earthquake coverage is available from private insurance companies or, in California, also through theCalifornia Earthquake Authority.

Replacement cost policies
Most policies cover replacement cost for damage to the structure. A replacement cost policy pays for the repair or replacement of damaged property with materials of similar kind and quality. There is no deduction for depreciation–the decrease in value due to age, wear and tear, and other factors.

If you purchase a flood insurance policy, coverage for the structure is available on a replacement cost basis.

Guaranteed or extended replacement cost coverage
After a major hurricane or a tornado, building materials and construction workers are often in great demand. This can push rebuilding costs above homeowners policy limits, leaving you without enough money to cover the bill. To protect against such a situation, you can buy a policy that pays more than the policy limits.

An extended replacement cost policy will pay an extra 20 percent or more above the limits, depending on the insurance company. A guaranteed replacement cost policy will pay whatever it costs to rebuild your home as it was before the fire or other disaster.

Building codes
Building codes are updated periodically and may have changed significantly since your home was built. If your home is badly damaged, you may be required to rebuild your home to meet new building codes. Generally, homeowners insurance policies (even a guaranteed replacement cost policy) won’t pay for the extra expense of rebuilding to code. Many insurance companies offer an Ordinance or Law endorsement that pays a specified amount toward these costs. (An endorsement is a form attached to an insurance policy that changes what the policy covers.)

Inflation guard
Consider adding an inflation guard clause to your policy. This automatically adjusts the dwelling limit when you renew your policy to reflect current construction costs in your area.

Older homes
If you own an older home, you may not be able to buy a replacement cost policy. Instead, you may have to buy a modified replacement cost policy. This means that instead of repairing or replacing features typical of older homes, like plaster walls and wooden floors, with similar materials, the policy will pay for repairs using the standard building materials and construction techniques in use today.

Insurance companies differ greatly in how they insure older homes. Some won’t insure older homes for the replacement cost because of the expense of re-creating special features like wall and ceiling moldings and carvings. Other companies will insure older homes for the replacement cost as long as the dwelling is in good condition.

If you can’t insure your home for the replacement cost or choose not to do so–in some cases, the cost of replacing a large old home is so high that you might not want to replace it with a house of the same size–make sure the limits of the policy are high enough to provide you with a house of acceptable size and quality.

Your personal possessions

Most homeowners insurance policies provide coverage for your personal possessions for approximately 50 percent to 70 percent of the amount of insurance you have on the structure or “dwelling” of your home. The limits of the policy typically appear on the Declarations Page under Section I, Coverages, A. Dwelling.

To determine if this is enough coverage, you need to conduct a home inventory. This is a detailed list of everything you own and information related to the cost to replace these items if they were stolen or destroyed by a disaster such as a fire (for more information see How do I take a home inventory and why). If you think you need more coverage, contact your agent or insurance company representative and ask for higher limits for your personal possessions.

Replacement Cost or Actual Cash Value
You can either insure your belongings for their actual cash value, which pays to replace your home or possessions minus a deduction for depreciation up to the limit of your policy. Or you can opt for replacement cost, which pays the actual cost of replacing your home or possessions (no deduction for depreciation) up to the limit of your policy.

Suppose, for example, a fire destroys a 10-year-old TV set in your living room. If you have a replacement cost policy for the contents of your home, the insurance company will pay to replace the TV set with a new one. If you have an actual cash value policy, it will pay only a percentage of the cost of a new TV set because the TV has been used for 10 years and is worth a lot less than its original cost. Some replacement cost policies also replace the item and deliver it to you.

Generally, the price of replacement cost coverage is about 10 percent more than that of actual cash value. If you need a flood insurance policy for your belongings, it is only available on an actual cash value basis.

Insuring expensive items with floaters/endorsements
There may be limits on how much coverage you get for expensive items such as jewelry, silverware and furs. Generally, there is a limit on jewelry for $1,000 to $2,000. You should ask your agent or look it up in your policy. This information is in Section I, Personal Property, Special Limits of Liability. Insurance companies may also place a limit on what they will pay for computers.

If the limits are too low, consider buying a special personal property floater or an endorsement. These allow you to insure these items individually or as a collection. With floaters and endorsements, there is no deductible. You are charged a premium based on what the item (or collection) is, its dollar value and where you live.

You can determine the value by providing your agent with a recent receipt or getting the item or collection appraised.

Additional living expenses after a disaster

This is a very important feature of a standard homeowners insurance policy. This pays the additional costs of temporarily living away from your home if you can’t live in it due to a fire, severe storm or other insured disaster. It covers hotel bills, restaurant meals and other living expenses incurred while your home is being rebuilt.

Coverage for additional living expenses differs from company to company. Many policies provide coverage for about 20% of the insurance on your house. Some companies will even sell you a policy that provides you with an unlimited amount of loss of use coverage, for a limited amount of time.

If you rent out part of your house, this coverage also reimburses you for the rent that you would have collected from your tenant if your home had not been destroyed.

You should talk to your agent or company to make sure you know exactly how much coverage you have and how long the coverage will be in effect. In most cases, you can increase this coverage for an additional premium.

Liability to others

This part of your policy covers you against lawsuits for bodily injury or property damage that you or family members cause to other people. It also pays for damage caused by pets. It pays for both the cost of defending you in court and for any damages a court rules you must pay.

Generally, most homeowners insurance policies provide a minimum of $100,000 worth of liability insurance, but higher amounts are available. Increasingly, it is recommended that homeowners consider purchasing at least $300,000 to $500,000 worth of coverage of liability protection.

Umbrella or Excess Liability.
You should buy enough liability insurance to protect your assets. If you own property and or have investments and savings that are worth more than the liability limits in your policy, you may consider purchasing an excess liability or umbrella policy.

Umbrella or excess liability policies provide extra coverage. They start to pay after you have used up the liability insurance in your underlying home (or auto) policy. An umbrella policy is not part of your homeowners policy. You have to purchase it separately. In addition to providing a higher dollar amount, they offer broader coverage. You are covered for libel, slander, and invasion of privacy. These things are not covered under standard homeowners or auto policies.

The cost of an umbrella policy depends on how much underlying insurance you have and the kind of risk you represent. The greater the underlying liability coverage, the cheaper the policy. This is becaue you would be the less likely to need the additional insurance. Most companies will require a minimum of $300,000 on your home and your car, if you own one.

Source: Insurance Information Institute http://www.iii.org/

Changing Insurance Needs: Baby BOOM!

Children are the future. We need to plan for their future and we need to protect it. As the saying goes, it will be here before we know it. A family’s insurance and financial needs will grow and change over time as we take steps to manage our finances; and protect our property and lifestyle against significant changes in our life or health.

AUTO

As the children grow up, families spend more time in the car – or so it seems – dropping kids off at school, driving to basketball or soccer games and other youth activities. But, as parents, we tend to become more careful behind the wheel and generally enjoy lower insurance rates. The family car is not likely to be a Ferrari, but a mini-van, which is less costly to insure. It’s important to pay attention to the children’s safety. Infants should ride in car seats that are properly installed. Youngsters should sit in the back and wear seatbelts. Parents should set a good example, even if the police don’t write tickets for non-use of seatbelts as a primary offense. The insurance industry supports the presence of side and smart air bags, which are less likely to cause injury if deployed and more likely to save lives in the event of a serious accident.

HOME

With children, we acquire more “stuff,” particularly electronic equipment. Between homework research on the Internet and after-school relaxation, we now tend to have multiple televisions, computers and stereos in the house (with the volume too high). Make sure your homeowner’s insurance keeps pace with a growing family. The larger the home, the more it will cost to insure it, because the insurance company is assuming more risk. Consider inflation protection so that the homeowners insurance automatically rises with property values in your region. Safety features such as alarm systems, smoke detectors, strong doors and deadbolts not only keep the family safe, they save money because they reduce the likelihood of insurance claims. If you plan to add a family dog, check with your insurer before bringing home an aggressive breed. If you have a backyard pool, trampoline or swing set, consider increasing your liability coverage through an umbrella policy in case someone is injured while playing on your property.

LIFE

Couples should take a close look at life insurance once children arrive. This is when it hits home that others are depending on you and your income. You want to be sure the family has the resources to maintain the home and have all the opportunities you want them to if you are not there. If you don’t have a strong savings program, a small life insurance policy on your children may make sense.

HEALTH

Most people get their health insurance through an employer. These plans include family members. Medical inflation is rising dramatically today and employers are increasing the amount they expect workers to pay as they cope with health care costs. Families with two working spouses should compare coverage, co-pays and costs and choose the best mix that offers the best coverage for the least amount of money.

DISABILITY

When you are a relatively younger, you are four times more likely to be disabled than to die. Thankfully, neither one is likely, but it is something to strongly consider, particularly if your lifestyle would be threatened if you are physically unable to work. Most large companies offer group disability coverage. Small companies may or may not have similar coverage.

LONG-TERM CARE

Middle age is the best time to consider whether to buy long-term care insurance. This is when you will most likely to be eligible and when the premiums will be the lowest. A healthy 65 year-old person can expect to pay between $2,000 and $3000 a year for a policy that covers nursing home and home care.

FINANCIAL PLANNING

If kids were born with a price tag on how much they cost through age 21, we’d undoubtedly have a moment of sticker shock. But once children come into our lives, it’s time to really get serious about a savings program. A major issue for families with children is how to best prepare to send the kids to college. The cost of tuition and room and board for four years now approaches $40,000 for public universities and exceeds $73,000 for private schools. In general, most students qualify for some kind of financial aid. But the current budget squeeze is requiring schools to raise tuition to close budget gaps, so costs are increasing in double-digits in many cases. There are a variety of plans available that are geared towards educational expenses, from the Coverdale IRA to 529 Plans. Depending on qualifying levels of income, contributions to these accounts may be tax deductible. In both cases, money grows tax-deferred. In both cases, proceeds are not taxed if used for qualifying educational expenses. Families looking for additional ways to shelter income can also look at Uniform Gift to Minors accounts. Parents serve as custodians during the early years, but when your kids reach the age of 18, the money is theirs and they can spend it any way they want.

Source: Insurance Information Institute http://www.iii.org/

Changing Insurance Needs: Domestic Partners

Since insurance and domestic partnership laws are different in each state, it’s best to consult with a financial advisor or lawyer who is familiar with laws affecting domestic partnerships in your state.

AUTO

When you buy a car, it is titled. The most practical approach to getting insurance is to ensure that both names are on the title. Most auto insurance policies have one person as the primary driver and others in the household who regularly use the car as secondary drivers. Traditional rating factors, such as the age of drivers, and claim and driving records, will come into play. Depending on the insurance company, a discount may be available to domestic partners involved in a long-term relationship. Some insurance companies will offer a discount, while others don’t, so compare coverage and rates of several companies to see what is available.

HOME

For homeowners, it is likewise important to have both names on the mortgage. This gives both partners an “insurable interest” in the property. If one person owns the home, the other should have separate renter’s coverage to protect his or her personal possessions. Keep receipts so it is clear who should claim what items, even if those items were jointly purchased. In homeowners insurance, the most important factor is the property itself, and the claims history of that property. Insurers also pay attention to the claims history of people who live in the home through loss history reports.

LIFE

Is your partner dependent on your income? Are you dependent on your partner’s income? If the answer is yes to either of those questions, consider purchasing a life insurance policy. You can name your partner as the beneficiary. When determining how much coverage you need, you should consider the following:

• Lost income
• Outstanding debts, such as a mortgage
• Estate costs

HEALTH

Increasingly, many employers offer health benefits for domestic partners. If you have this option, you may want to consider adding your partner to your health insurance. Keep in mind that this may involve an additional payroll deduction. If you are both working, and have separate health insurance policies, you should take the time to calculate whether dropping one partner’s health coverage and adding that partner to the other’s coverage makes financial sense. You should look at:

• Payroll deductions for each plan
• Deductibles for each plan
• Whether your personal doctors are covered under each plan

DISABILITY

If you are young and healthy, you may not have considered disability income insurance. Statistics show that the younger you are, the more likely you are to become disabled then die. Disability income insurance protects you and your partner financially if either of you has an injury or illness that results in the inability to work for a long period of time. Factors influencing the premium you will pay include age, gender, benefit amount, benefit period, current health status, your present job, and whether you smoke or not. The definition of disability will also have an effect on your premium. A policy that covers you for lost wages if you are no longer able to perform the duties of your present job is more expensive then a policy that pays benefits if you are unable to perform the duties of any job. Some companies offer discounts for policies on more than one person.

LONG-TERM CARE

The importance of long-term care increases with age. However, more people are beginning to buy coverage in mid-life. It may not be practical to purchase the insurance before age 50. It will increase in cost at age 60 and 70. It is also important to remember that new insurance becomes unavailable to people on their 80th birthday, so locking in coverage before then is important.

FINANCIAL PLANNING

It makes sense to consult with a financial advisor who is experienced in domestic partnerships. It is important to have a will and clearly spell out who you want to inherit your assets. To the extent possible, establish joint accounts for your checking, savings and investment accounts. Most individual retirement accounts require you to specify a beneficiary. The last thing you want is a family feud over your estate after you are gone.

Source: Insurance Information Institute http://www.iii.org/

Changing Insurance Needs: Divorce

Since nearly half of all marriages fail, divorce is unfortunately very real for many people. Couples face the difficult task of separating emotionally and financially. This has insurance implications as well. Legal and financial advice will be critical, particularly if there are children involved. Divorce can have a serious impact on one’s credit standing, both in terms of dividing joint debt that exists at the time of divorce and expenses that come with starting over. Paying close attention to existing obligations and monitoring credit reports at this time is critically important.

AUTO

A divorced couple will need to decide who gets which car. A change in car ownership will mean a change in insurance. Let your insurance company know about a change of address; who will now be driving the car; and any change in the type or amount of driving that will be done. These details will have an effect on your insurance premium. If someone needs to buy a new car, new insurance will need to be arranged before the car is registered. Removing a former spouse from the insurance policy also protects you from possible liability if they are involved in an accident and get sued.

HOME

Divorce will mean a change of address for one or both parties. The insurer needs to know when there is a change in residence and property coverage. For example, if one party leaves and receives the jewelry in the divorce settlement, the insurer will need to know whether to cancel any special coverage for expensive jewelry. Likewise, if security modifications are made to the home, because one party is now living alone, tell the insurance company. Those security upgrades may qualify for a discounted rate. If moving from an owner occupied home to a rental property, consider getting renter’s insurance to cover personal possessions and liability.

LIFE

Many married couples buy life insurance to cover existing and anticipated debts and financial obligations. When a couple divorces, these obligations generally still exist and life insurance should be considered as part of the final divorce decree. Married couples generally list each other as the beneficiary on life insurance policies. Carefully consider any changes. There may be good reasons to continue to keep life insurance on a former spouse. If the spouse who is providing alimony and child support dies, this may mean a loss of income. Some divorced couples may also consider keeping (or purchasing) life insurance on the spouse who has the primary responsibility for raising the children. If he or she dies, costly childcare will need to be arranged. The divorce decree should include the funds to pay for this life insurance policy. This way, the spouse receiving alimony can make sure the premiums are paid and he or she is financially protected with life insurance. If a divorced couple is purchasing life insurance to provide financial protection for the children and money is tight, they may want to consider purchasing term coverage rather than whole life. Term is generally cheaper and it is designed to provide protection for a specific period of time – for example, until the children reach the age of 21.

HEALTH

Unless both spouses each have their own health insurance and there are no children, health insurance should be clearly agreed upon in the divorce decree. Federal law states that spouses and their dependent children who are currently insured by a health plan are eligible for Consolidated Omnibus Budget Reconciliation or COBRA coverage for 18 months. The divorce decree should state how this is going to be paid for and a plan should be legally agreed upon to make health insurance available after that time.

DISABILITY

A disability can threaten financial support that a former spouse and children depend upon. Disability insurance should be addressed in the divorce decree. Careful attention should be paid to how disability insurance should be funded. As with a life insurance policy, the former spouse receiving financial support should own the policy and pay the premiums to make sure that the policy remains in force and that the beneficiaries are not changed. The funds for this insurance should be represented in the amount of financial support the spouse and children receive.

LONG-TERM CARE

Long-term care insurance covers the cost of assistance to those who are unable to perform the normal daily activities that healthy, fully functional people are usually able to do on a daily basis. The need for long-term care services arises from chronic health conditions or physical disabilities such as multiple sclerosis, Parkinson’s or Alzheimer’s disease. Couples going through a divorce need to make sure that they take into account both the need to care for aging parents and dependent siblings as well as the cost of this insurance when assessing needs and allocating assets.

FINANCIAL PLANNING

There are two key things that divorcing couples should do prior to meeting with their insurance or financial advisor:

  1. List assets and liabilities: This should include real estate and personal property; checking, savings and investment accounts; retirement and pension plans; and life insurance. On the liability side, there are the mortgage, car and school loans; and home equity and credit card balances.
  2. Develop a budget: Income will be stretched to the limit because there are going to be two households instead of one. The budget should include normal living and household expenses; anticipated educational and business expenses; tax obligations; car and home mortgage payments; medical and dental costs; childcare and insurance premiums. There needs to be a firm understanding as to what is required of each spouse.

A trust may be appropriate to meet the educational needs of any children. This may include a written agreement regarding future contributions to this account to properly prepare for the increasing costs of tuition.

Divorced couples also need to look into the cash flow and tax implications for splitting assets. At first glance, a $100,000 savings account and a $100,000 traditional IRA may appear to have the same value. However, a spouse with custody of the children might have more everyday expenses and need greater access to cash than the non-custodial spouse. Generally, the IRA can’t be tapped until age 59 ½ without penalty. In the meantime, unlike a savings or investment account, proceeds are tax deferred. The vested portion of existing retirement plans should also be considered.

Military spouses who divorce should be aware of the Uniformed Services Former Spouse Protection Act, which recognizes the contributions that former spouses made to support the service member’s career and entitles the former spouse to a portion of the retirement pay. More information can be accessed at www.dfas.mil.

Source: Insurance Information Institute http://www.iii.org/